MJO
MJO Fortnightly Update
Issued: 1 Jul 2026
There were signs of a Madden-Julian Oscillation (MJO) signal developing towards the end of June 2026. Most models predict the MJO signal to propagate through the Western Pacific (Phase 6 to Phase 7) during Week 1 (6 – 12 July) and then weaken in Week 2 (13 – 19 July).
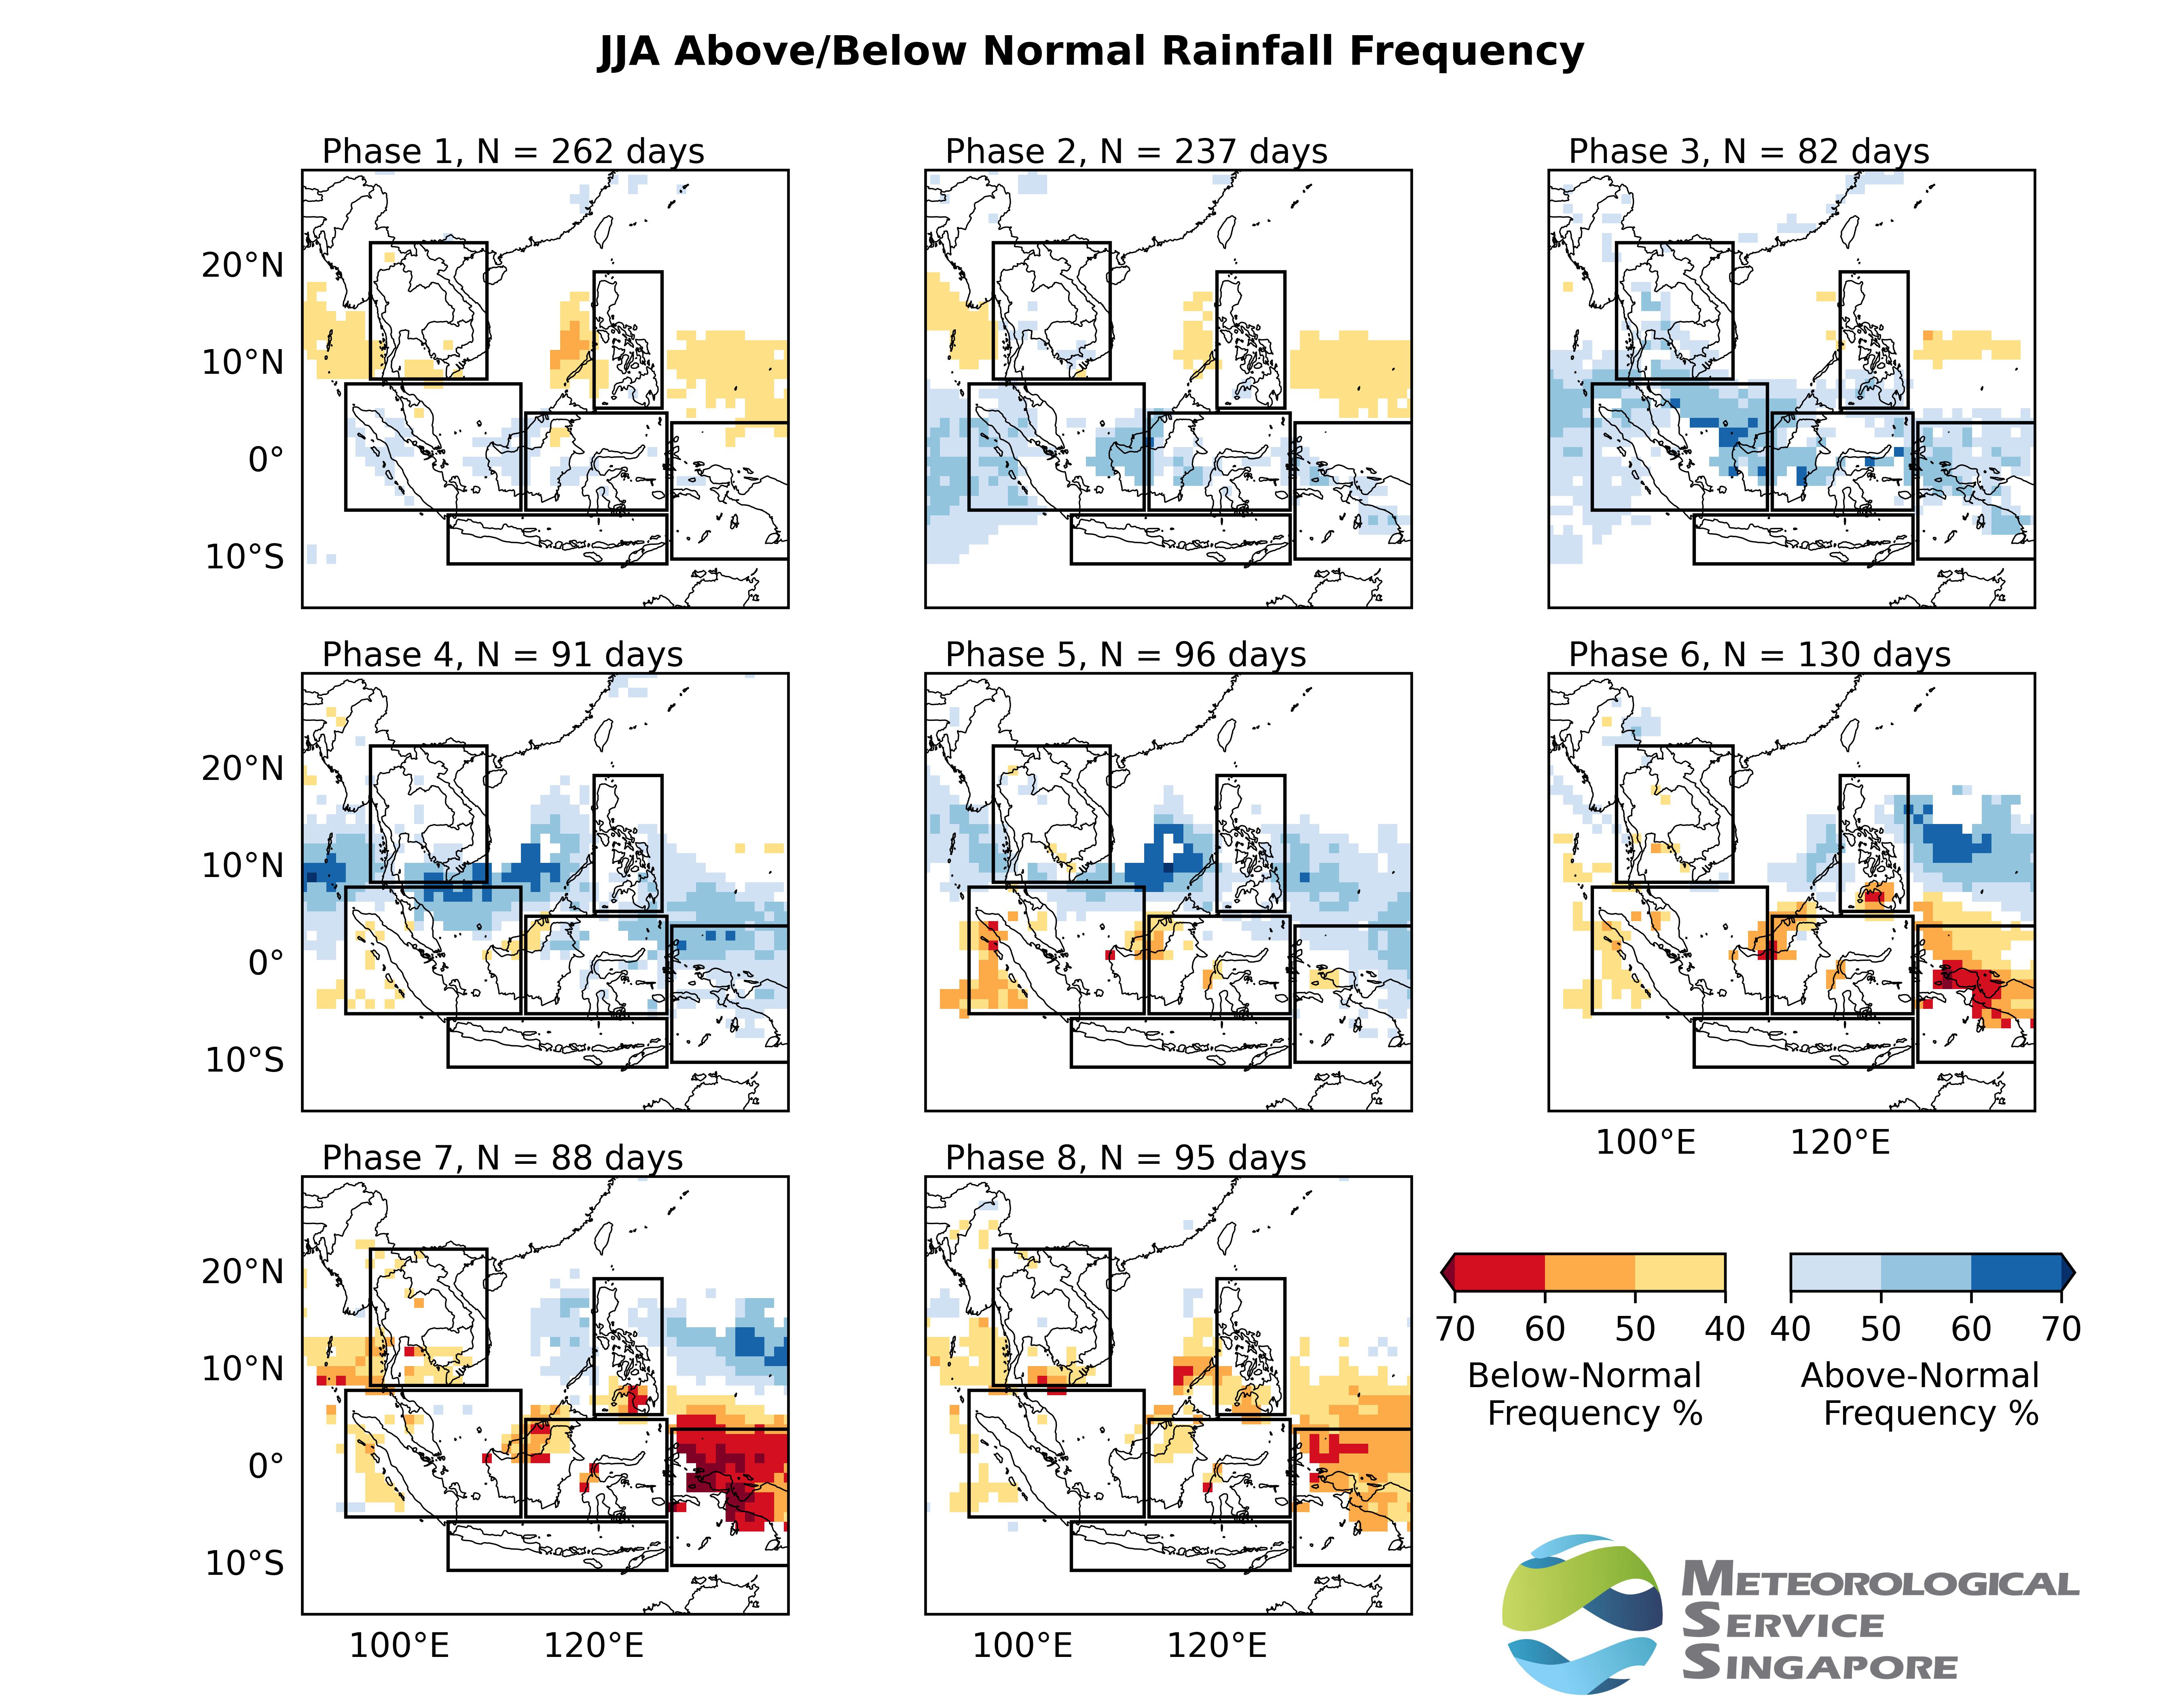
Figure 1: Below-normal and Above-normal rainfall frequencies for MJO phases based on GPCP (reference period: 2001-2020).
For each MJO phase, the below- and above-normal rainfall frequencies are computed as the ratio of days with values exceeding the lower upper tercile thresholds, respectively, to the total number of days in that phase.
N corresponds to the number of days for each MJO phase.
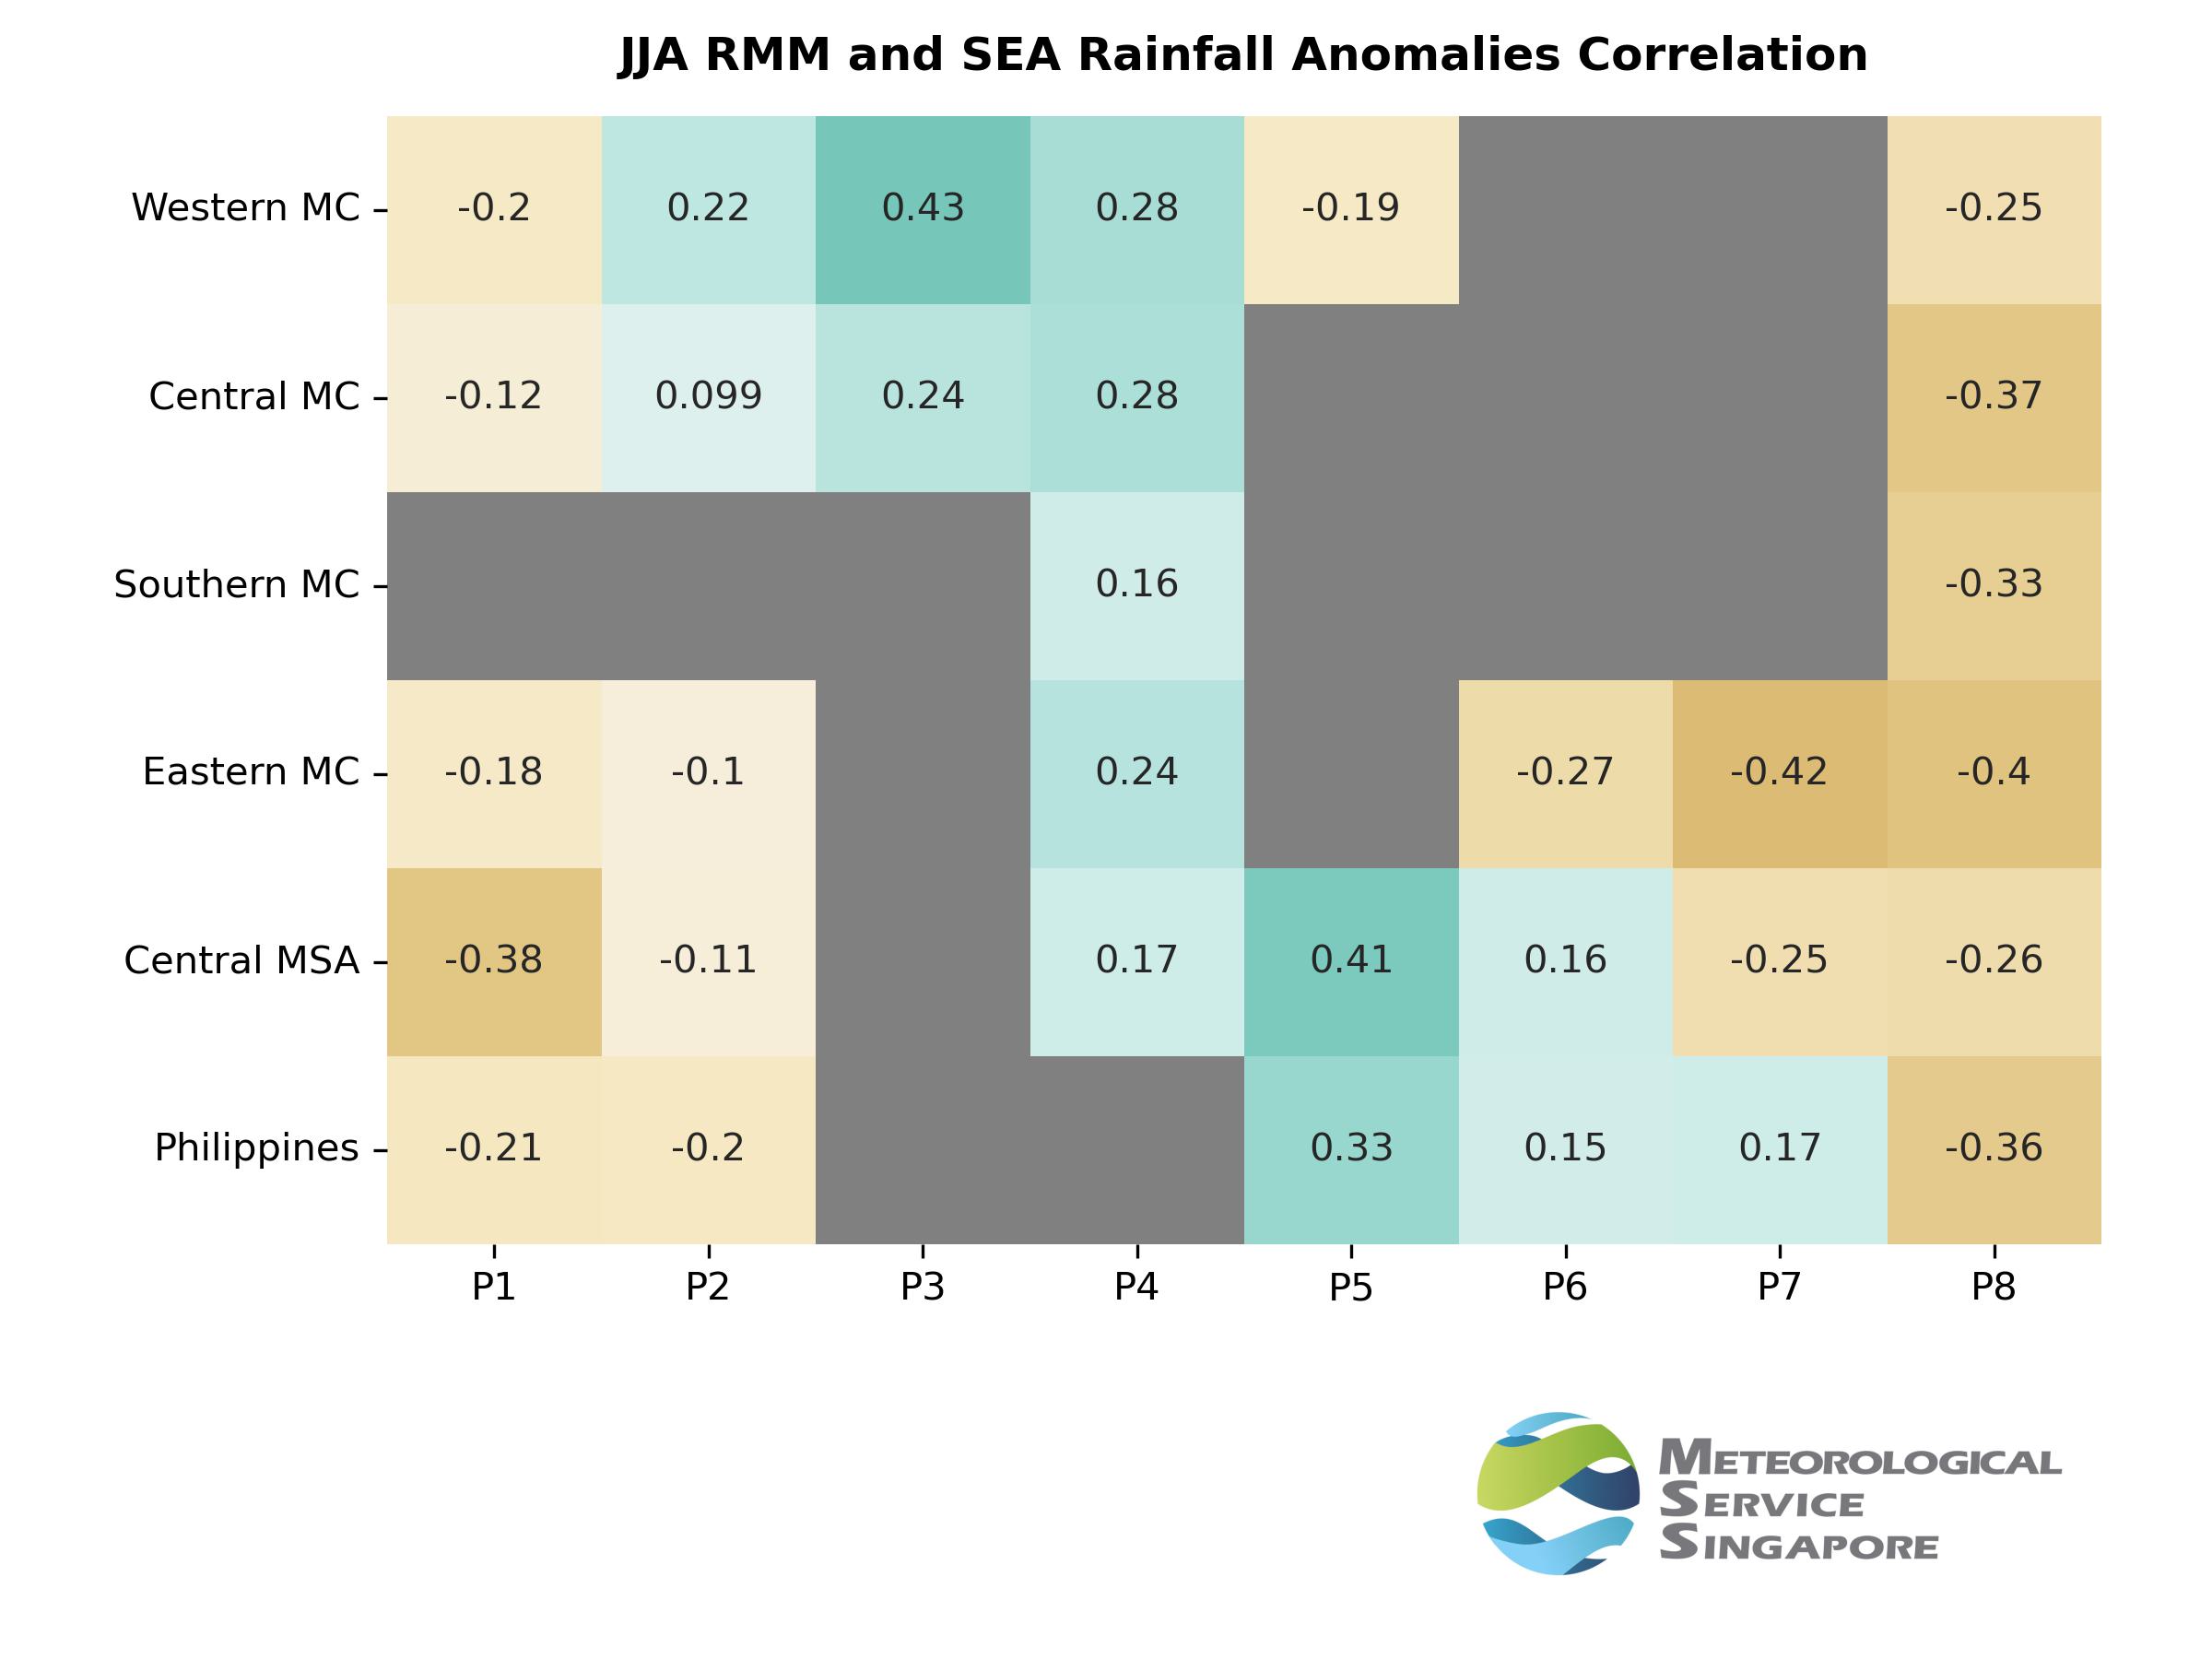
Figure 2: Correlation heatmap between RMM amplitude and 20–90 days bandpass-filtered daily rainfall anomalies based on GPCP data (Reference period: 2001–2020); Only correlation significant at the 95% level is shown.
MC = Maritime Continent; MSA = Mainland Southeast Asia.