ENSO
ENSO Outlook: June 2026
This page considers the ENSO outlook for the next three to six months, and the typical impact of El Niño and La Niña events on rainfall in Southeast Asia.
Current SST conditions are shown on the climate monitoring node website: sst - SEA Climate Monitoring
Latest Climate Outlook (June – November 2025): ENSO-neutral conditions to continue into JJA 2025, global climate models predict ENSO-neutral conditions to persist after JJA 2025
Updated: May 2025
Recent analysis of sea surface temperature (SST) anomalies over the equatorial Pacific shows average to slightly below-average SSTs across the equatorial Pacific Ocean, and along with atmospheric indicators such as trade wind strength and cloudiness, indicate ENSO-neutral conditions. In the Indian Ocean, the Indian Ocean Dipole (IOD) is neutral.
The international climate outlook predicts that ENSO-neutral conditions will continue into JJA 2025. After JJA 2025, most models predict ENSO-neutral conditions, although there is still a high amount of uncertainty for ENSO predictions issued in April.
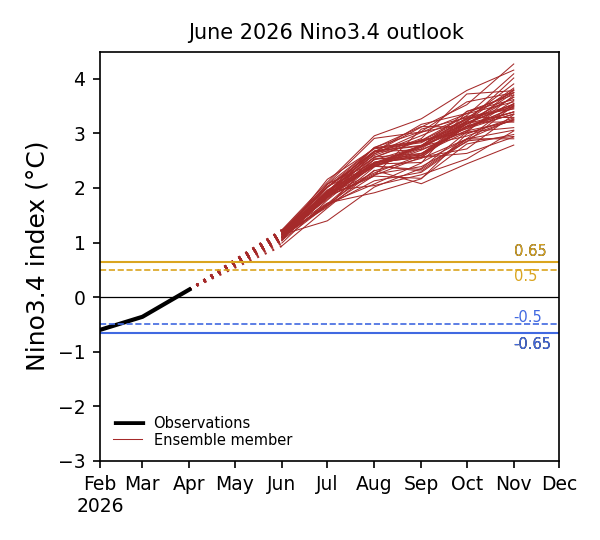
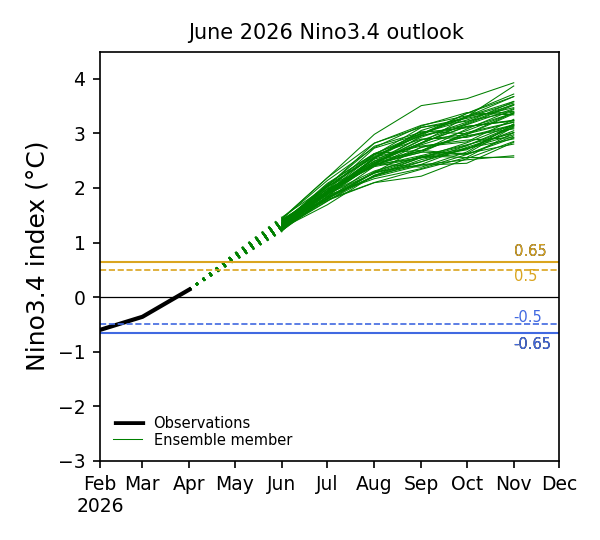
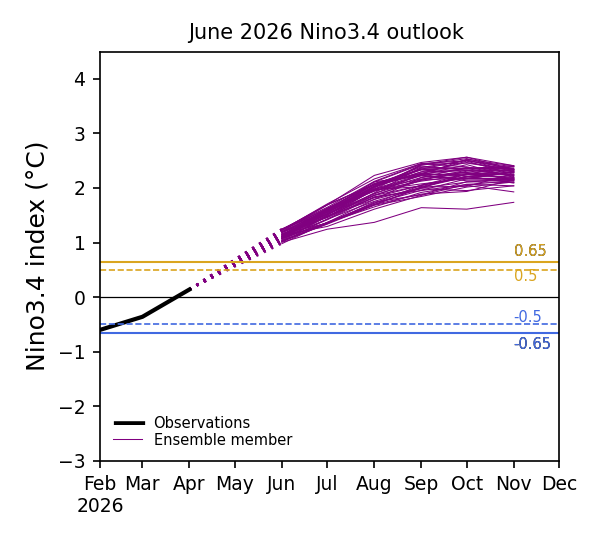
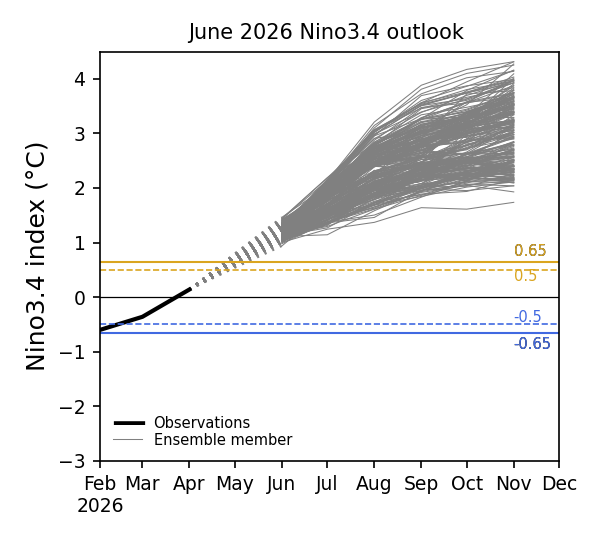
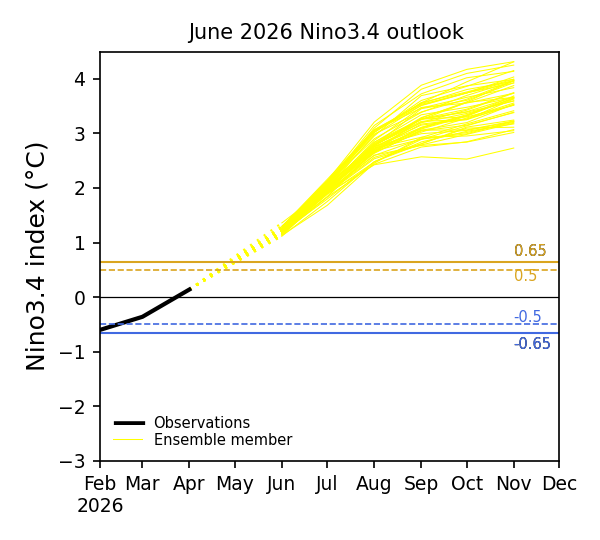
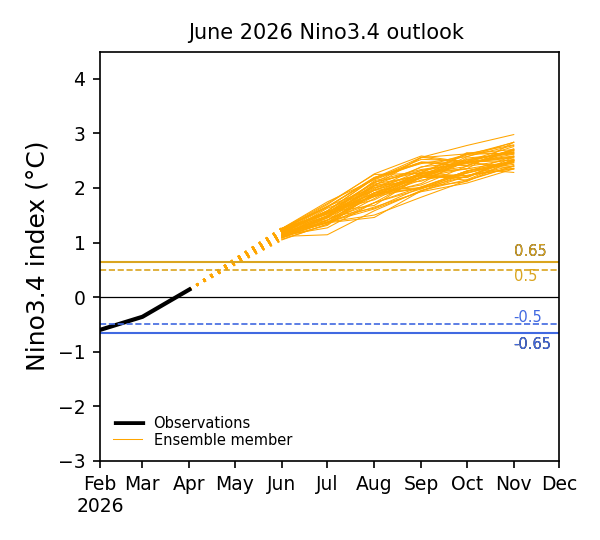
Latest Model Outlook
Model outlooks from Copernicus C3S (Figure 1), based on the Relative Nino3.4 SST index, predict the index to be above the El Niño threshold in June 2026. The El Niño conditions are predicted to continue at least until November 2026. Most models predict the El Niño conditions to be strong from August-September 2026. El Niño conditions typically peak around the end of the year and return to neutral the following year so, although the forecasts in Figure 3 are only to November 2026, the El Niño is very likely to continue beyond this date.
Impact of El Niño/La Niña on Southeast Asia
The typical impact of El Niño on Southeast Asia is drier-than-average rainfall conditions, including for much of the Maritime Continent during December to February (Figure 2, left). Warmer temperature conditions typically follow drier periods.
The opposite conditions for rainfall (and consequently temperature) are observed during La Niña years (Figure 2, right).
The impact on the region’s rainfall and temperature from ENSO events is more significantly felt during strong
or moderate-intensity events. Also, no two El Niño events or two La Niña events are exactly alike in terms of their impact on the region.
Figure 2: December to February (DJF) season rainfall anomaly composites (mm/day) for El Niño (left) and La Niña (right) years. Brown (green) shades show regions of drier (wetter) conditions. Note that this anomaly composite was generated using a limited number of El Niño and La Niña occurrences between 1979 and 2021 and therefore should be interpreted with caution (data: The Global Precipitation Climatology Project (GPCP) Monthly Analysis Version 2.3).
The typical impact of El Niño on Southeast Asia is drier-than-average rainfall conditions, including during March to May (Figure 2, left). Warmer temperature conditions typically follow drier periods. The opposite conditions for rainfall (and consequently
temperature) are observed during La Niña years (Figure 2, right).
The impact on the region’s rainfall and temperature from ENSO events is more significantly felt during strong or moderate-intensity events. Also, no two El Niño
events or two La Niña events are exactly alike in terms of their impact on the region. 
Figure 2: March to May (MAM) season rainfall anomaly composites (mm/day) for El Niño (left) and La Niña (right) years. Brown (green) shades show regions of drier (wetter) conditions. Note that this anomaly composite was generated using a limited number of El Niño and La Niña occurrences between 1979 and 2021 and therefore should be interpreted with caution (data: The Global Precipitation Climatology Project (GPCP) Monthly Analysis Version 2.3).
The typical impact of El Niño on Southeast Asia is drier-than-average rainfall conditions, including for much of the Maritime Continent during June to August (Figure 2, left). Warmer temperature conditions typically follow drier periods. The opposite
conditions for rainfall (and consequently temperature) are observed during La Niña years (Figure 2, right).
The impact on the region’s rainfall and temperature from ENSO events is more significantly felt during strong or moderate-intensity events. Also, no two El Niño events or two La Niña events are exactly alike in terms of their
impact on the region.
Figure 2: June to August (JJA) season rainfall anomaly composites (mm/day) for El Niño (left) and La Niña (right) years. Brown (green) shades show regions of drier (wetter) conditions. Note that this anomaly composite was generated using a limited number of El Niño and La Niña occurrences between 1979 and 2021 and therefore should be interpreted with caution (data: The Global Precipitation Climatology Project (GPCP) Monthly Analysis Version 2.3).
The typical impact of El Niño on Southeast Asia is drier-than-average rainfall conditions, including for much of the Maritime Continent during September to November (Figure 2, left). Warmer temperature conditions typically follow drier periods.
The opposite conditions for rainfall (and consequently temperature) are observed during La Niña years (Figure 2, right).
The impact on the region’s rainfall and temperature from ENSO events is more significantly felt during strong or moderate-intensity events. Also, no two El Niño events or two La Niña events are exactly alike in terms of their
impact on the region. 
Figure 2: September to November (SON) season rainfall anomaly composites (mm/day) for El Niño (left) and La Niña (right) years. Brown (green) shades show regions of drier (wetter) conditions. Note that this anomaly composite was generated using a limited number of El Niño and La Niña occurrences between 1979 and 2021 and therefore should be interpreted with caution (data: The Global Precipitation Climatology Project (GPCP) Monthly Analysis Version 2.3).