Recent Changes in Singapore's Climate
Quick Start
Sea Level - Recent Changes and Projections
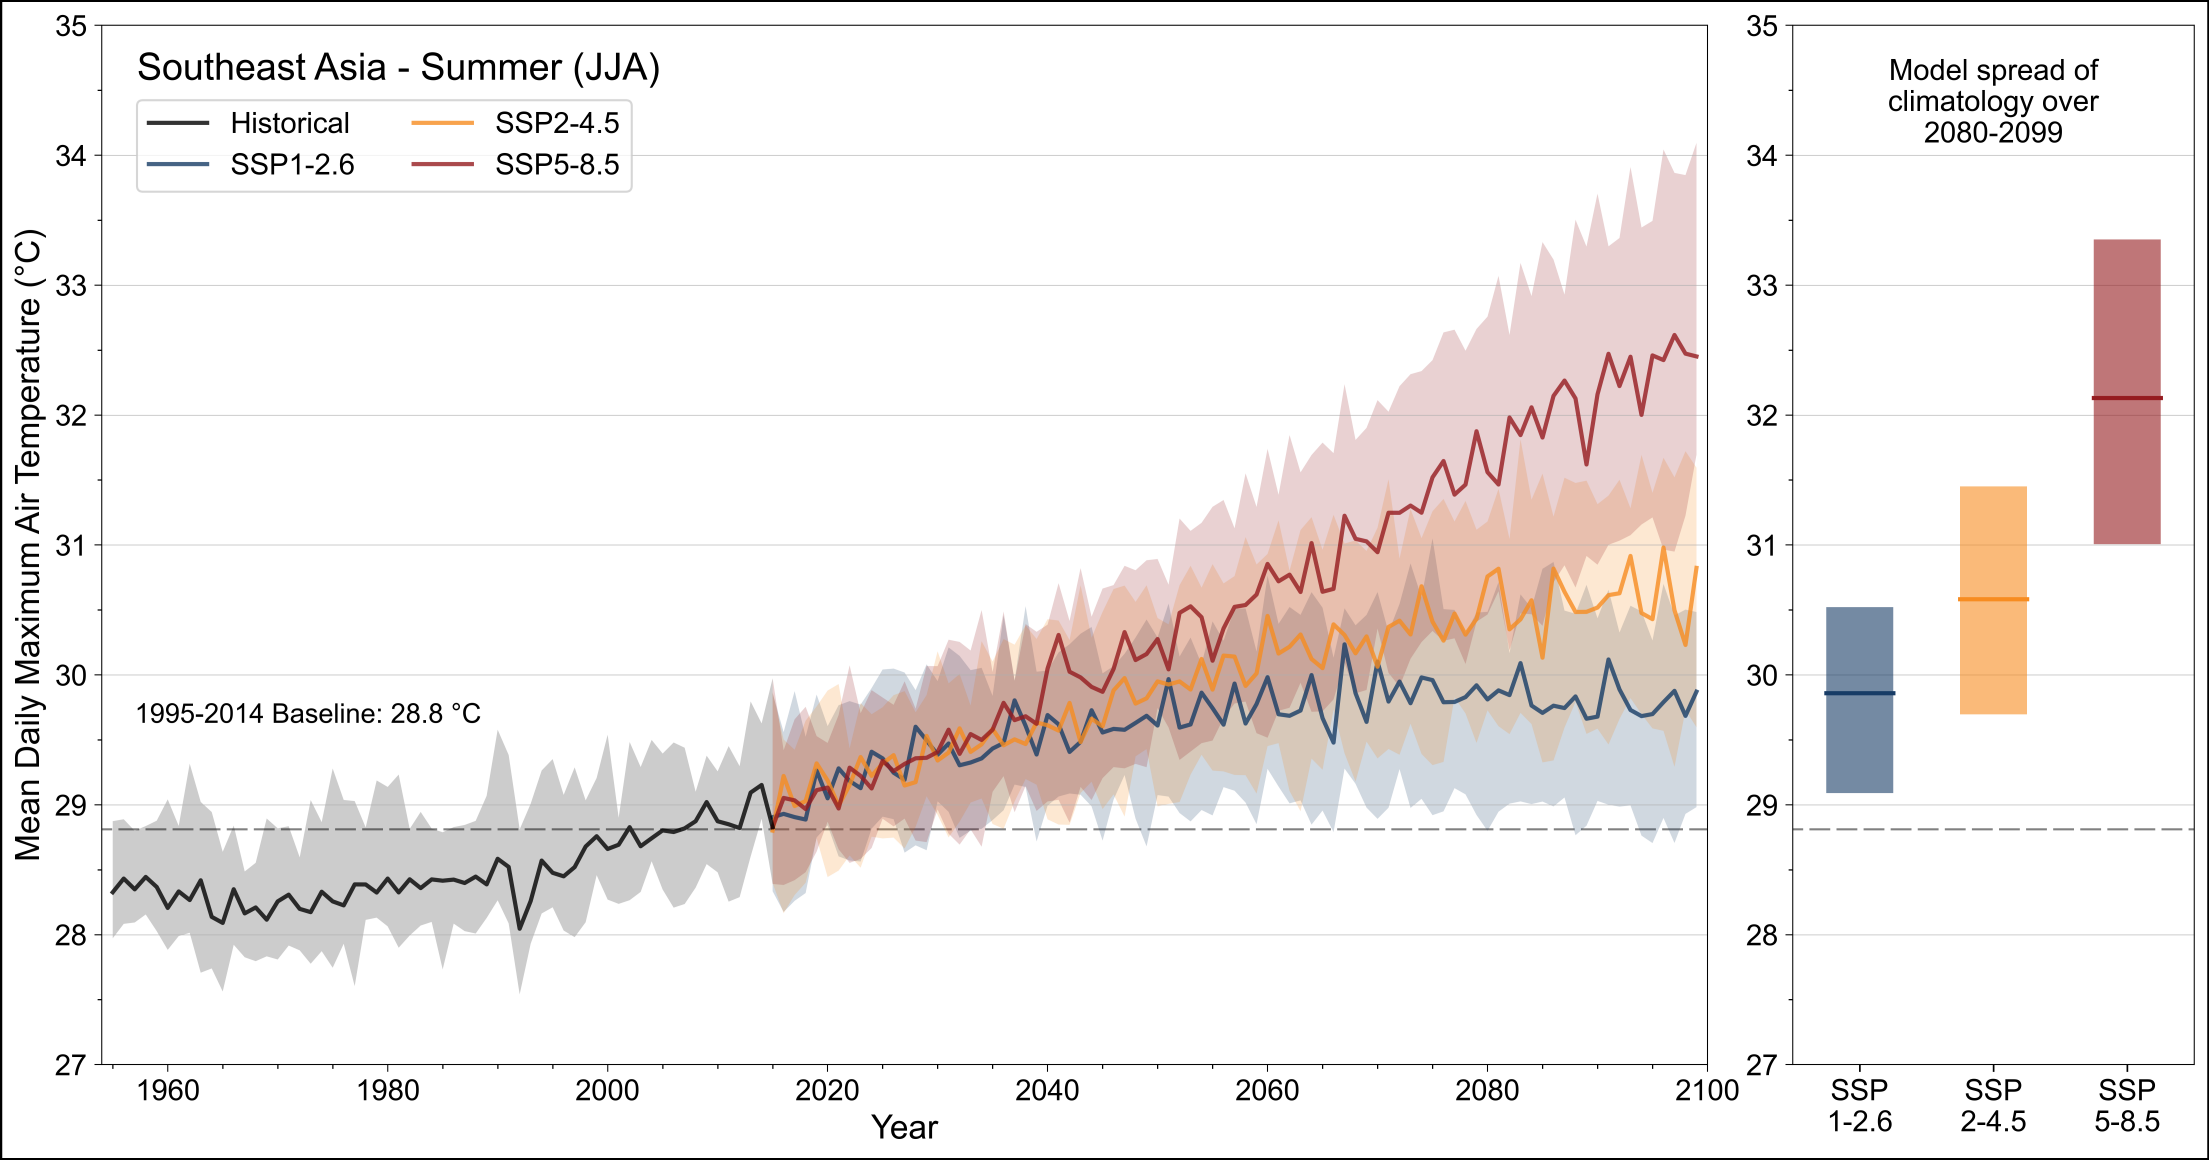
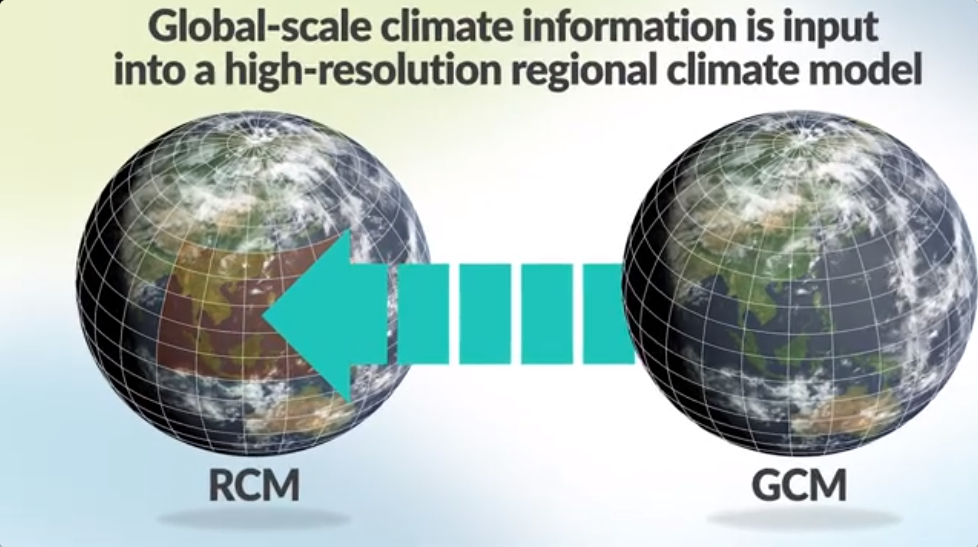
Climate Visualiser - Recent and Future Changes for Singapore and Southeast Asia
Learn about V3
Recent Changes in Singapore's Climate
Observations from stations with 40+ years of data reveal that Singapore's climate has undergone notable changes recently. Explore how temperatures, rainfall and humidity have changed since the 1980s.

Changes in Mean Temperature
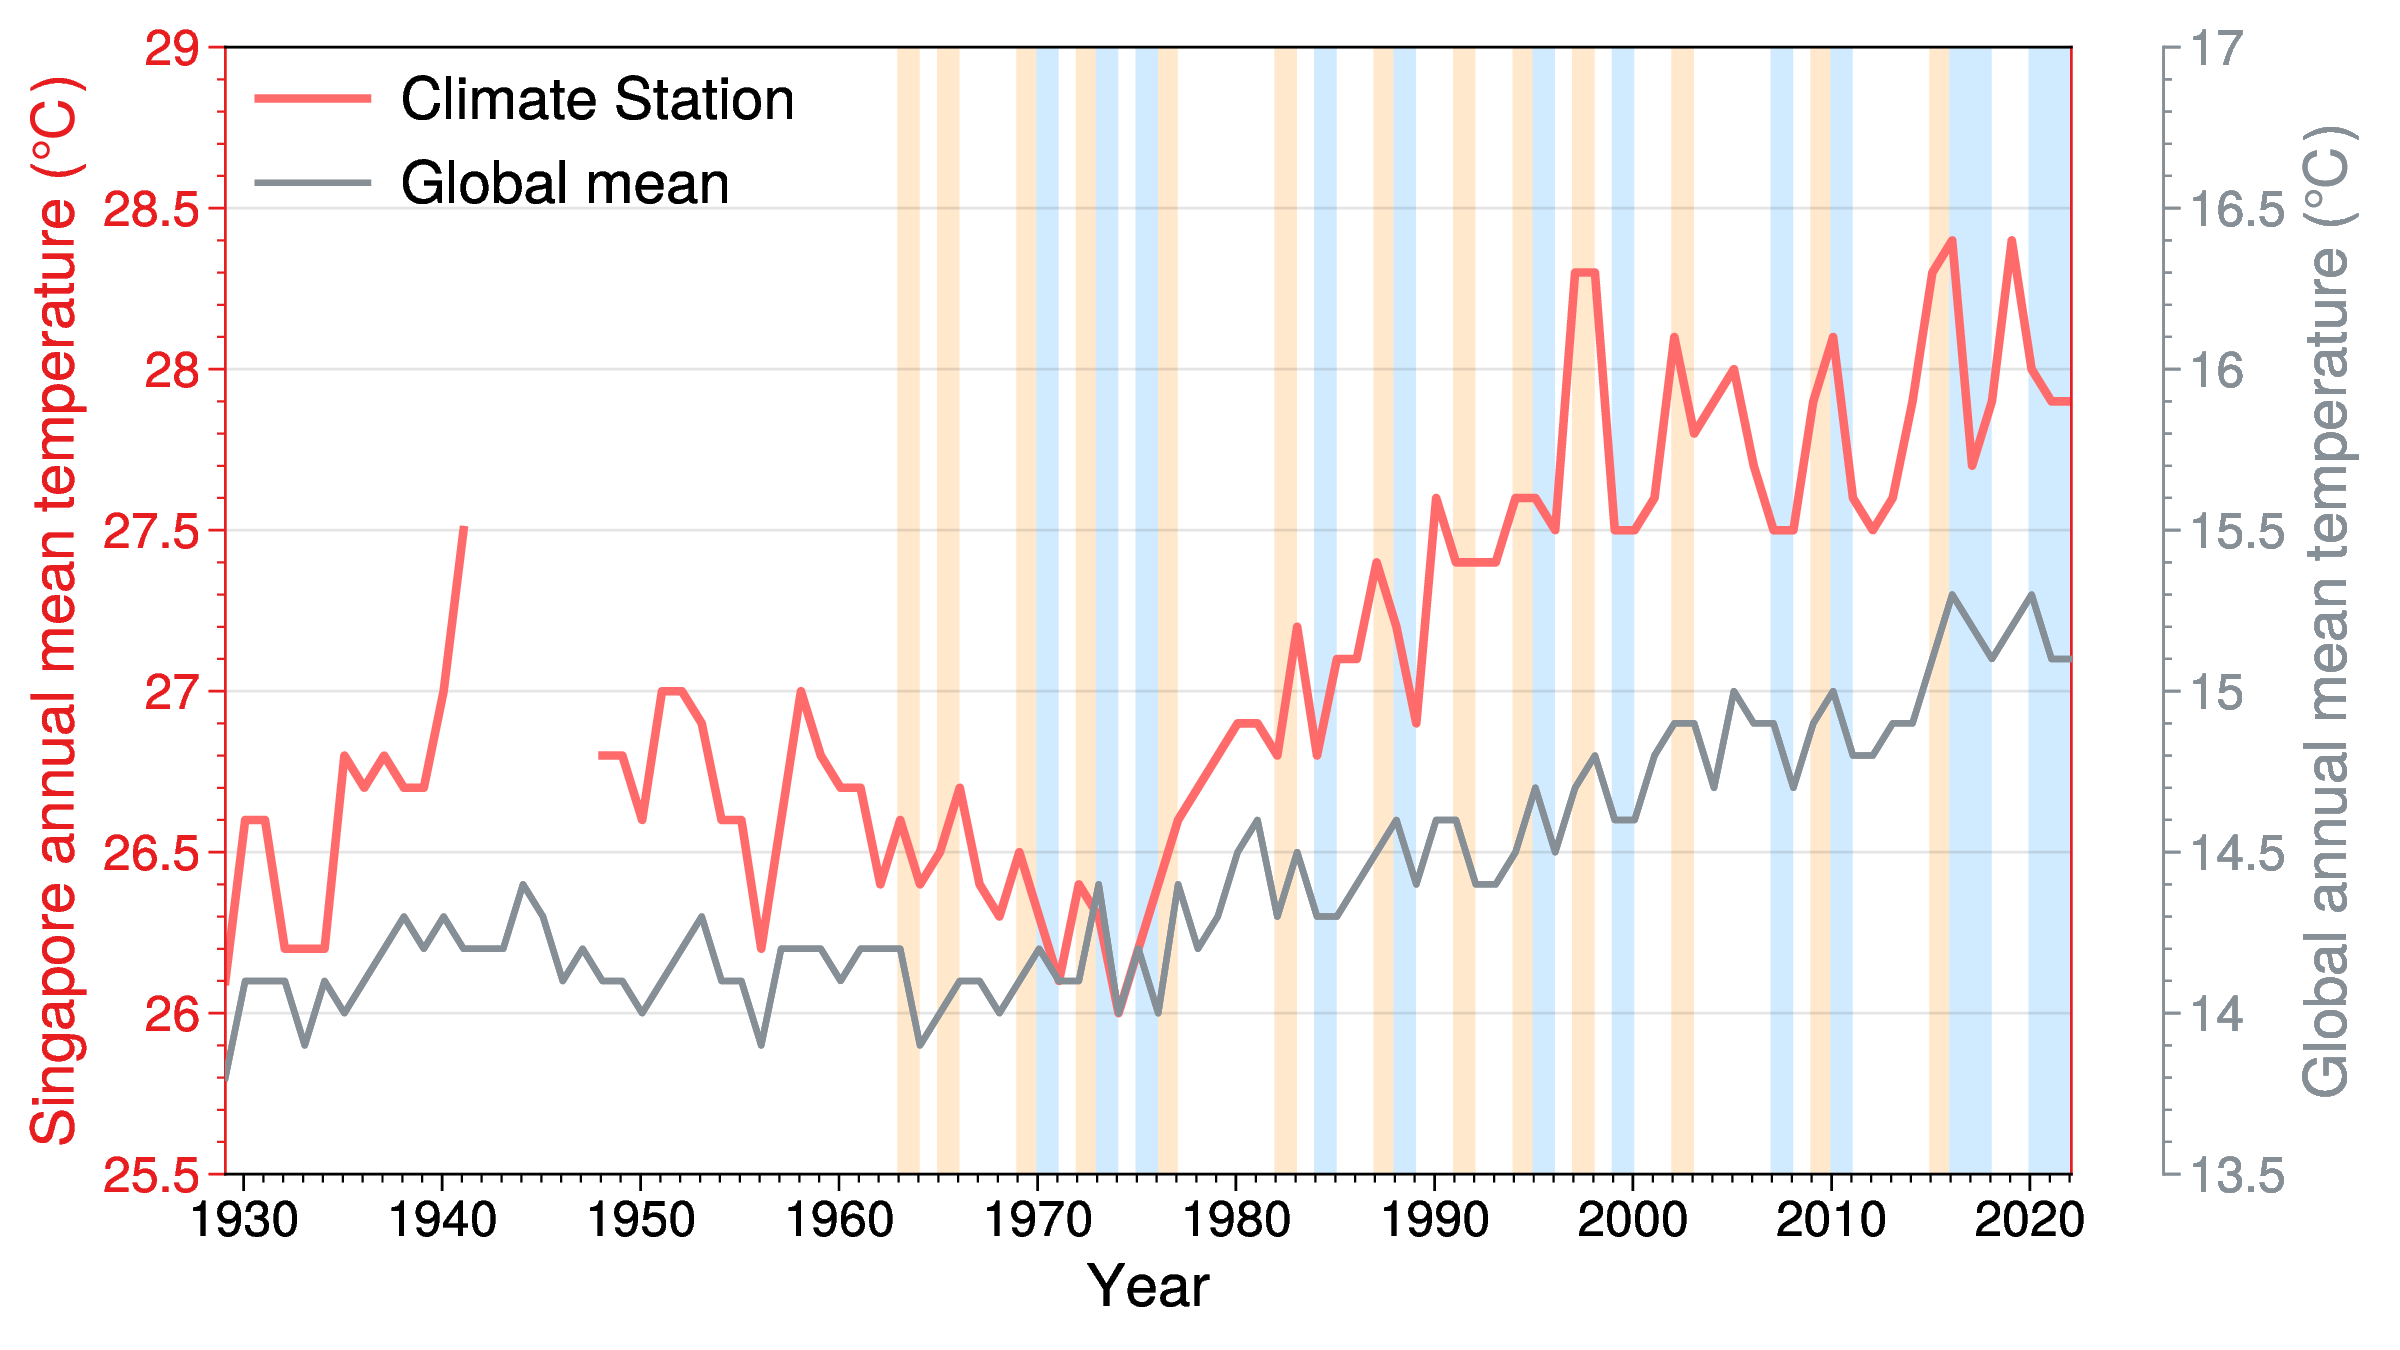
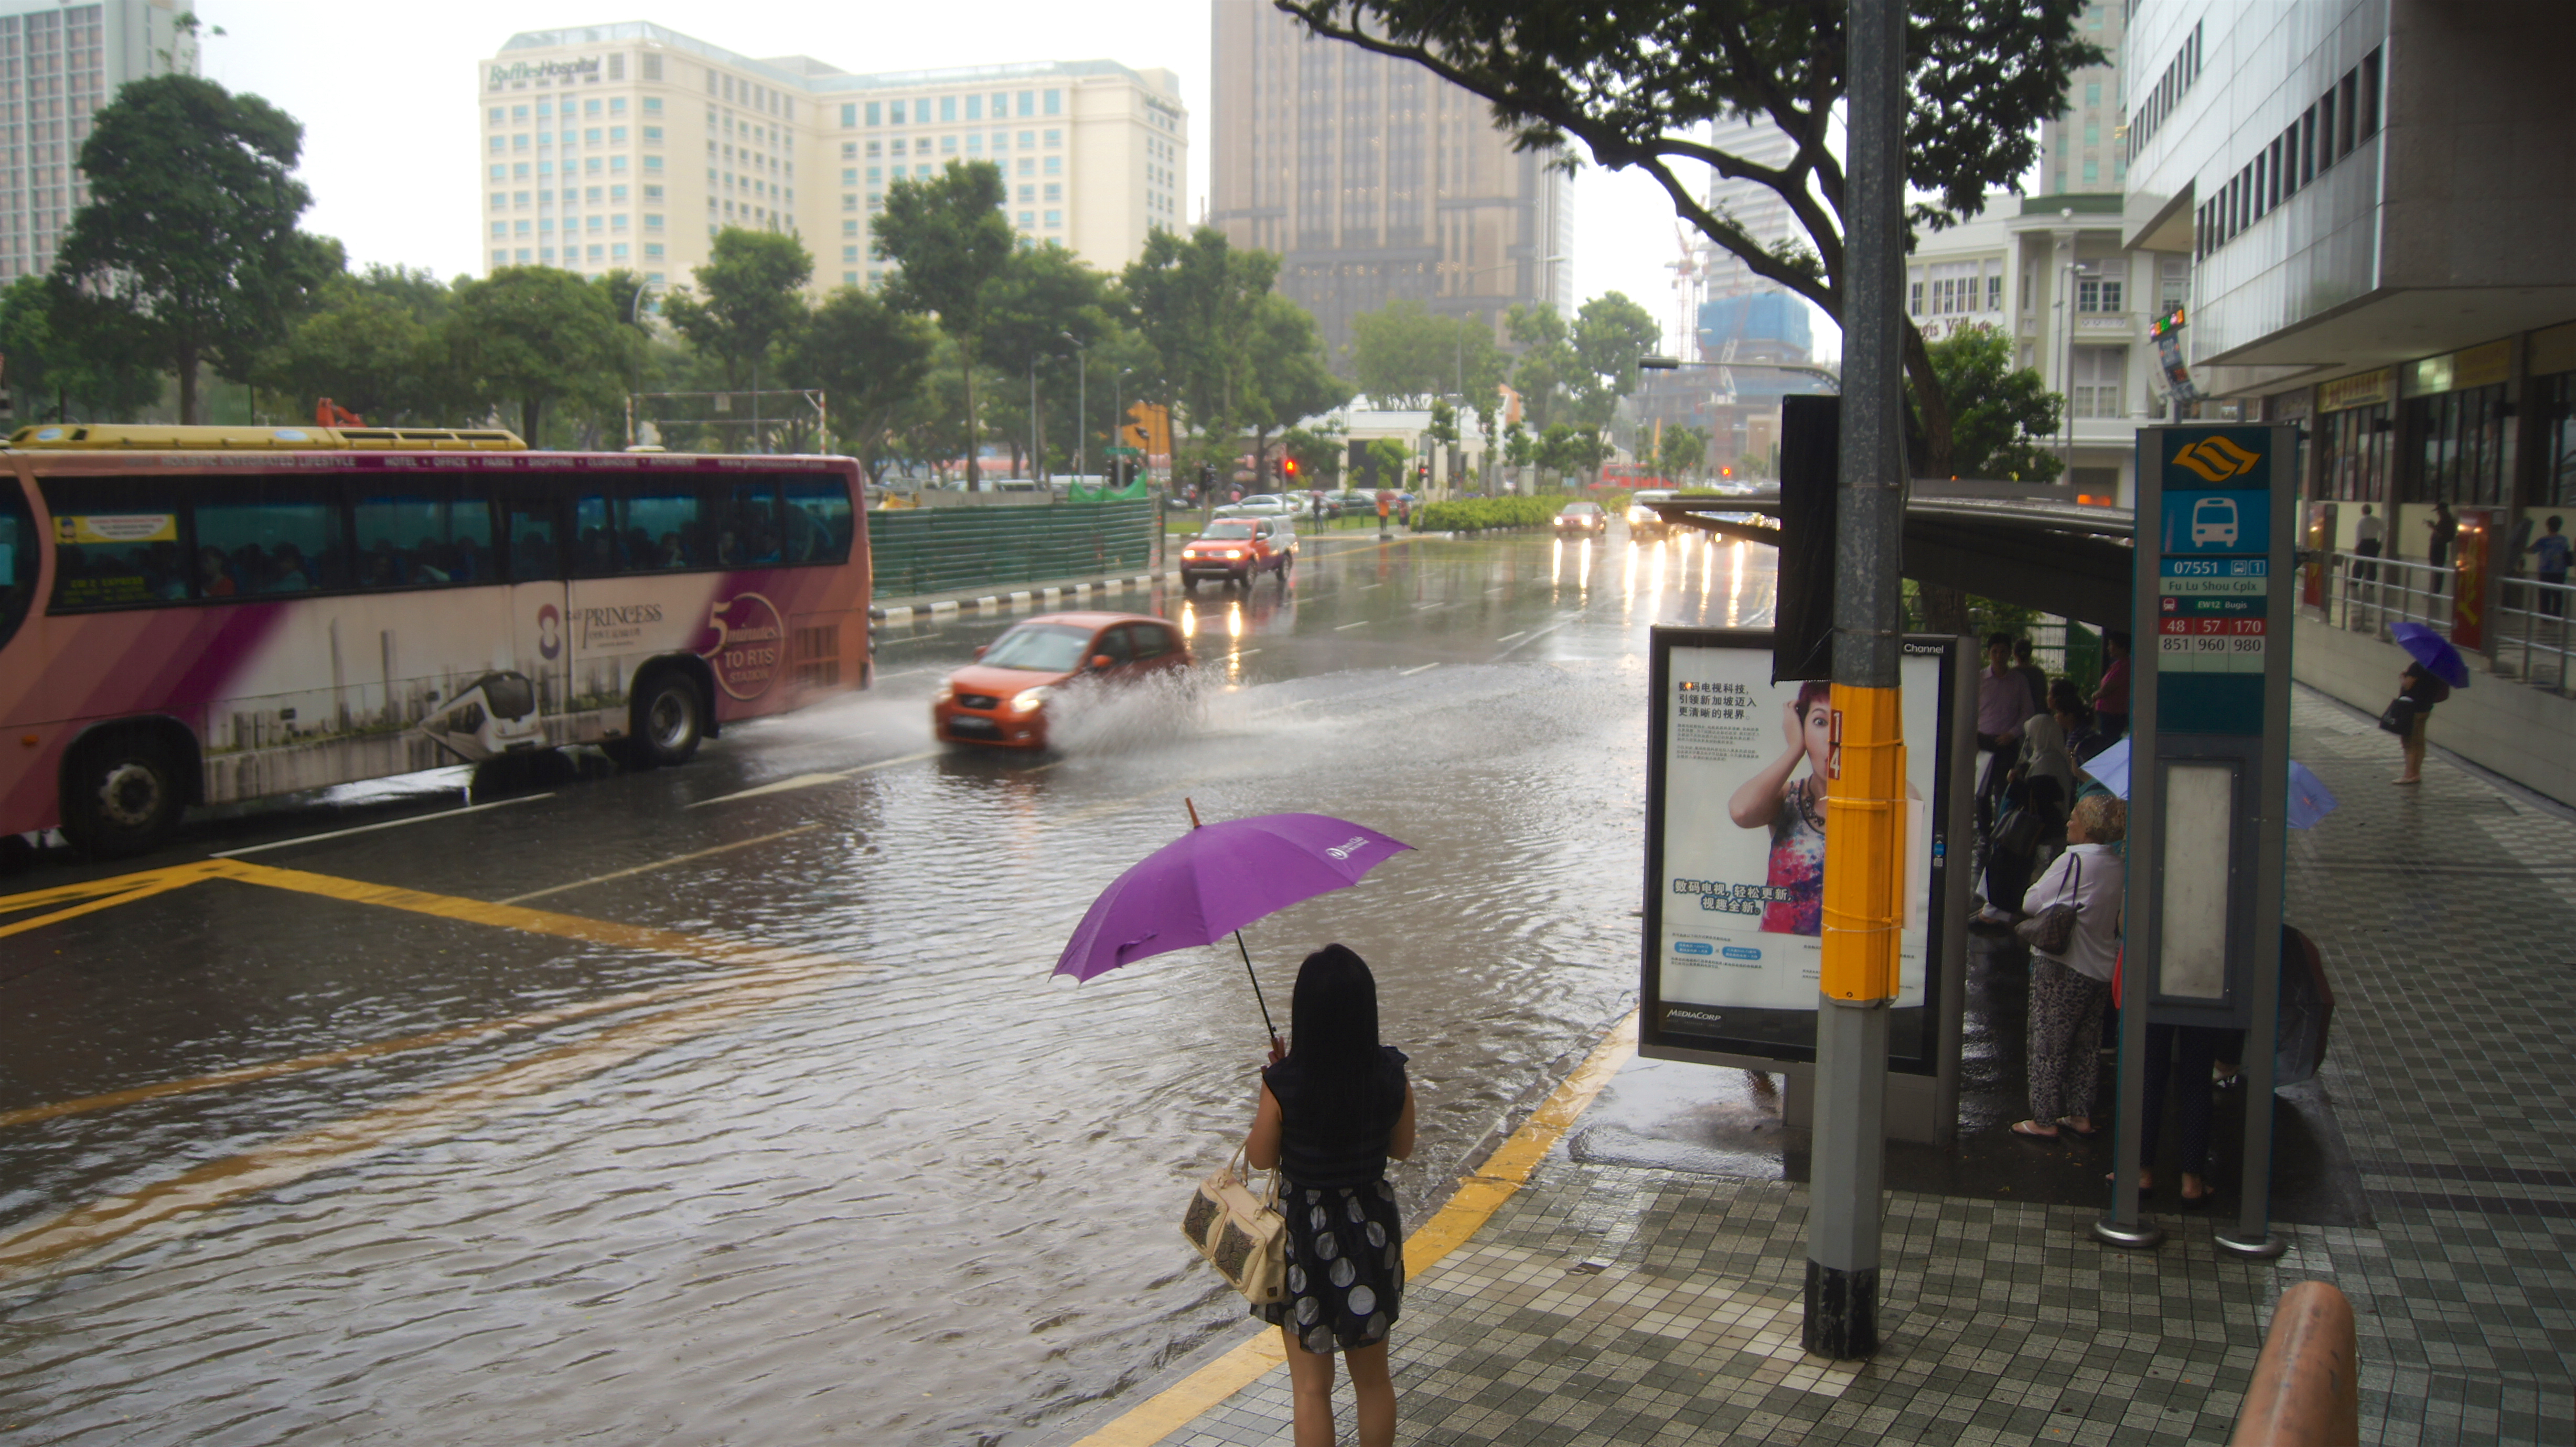
Singapore has been warming over the last 40 years at a rate of 0.24°C per decade. The days are becoming hotter and nights are increasingly warmer. Our coolest month now is hotter than our warmest month in the 1960s.

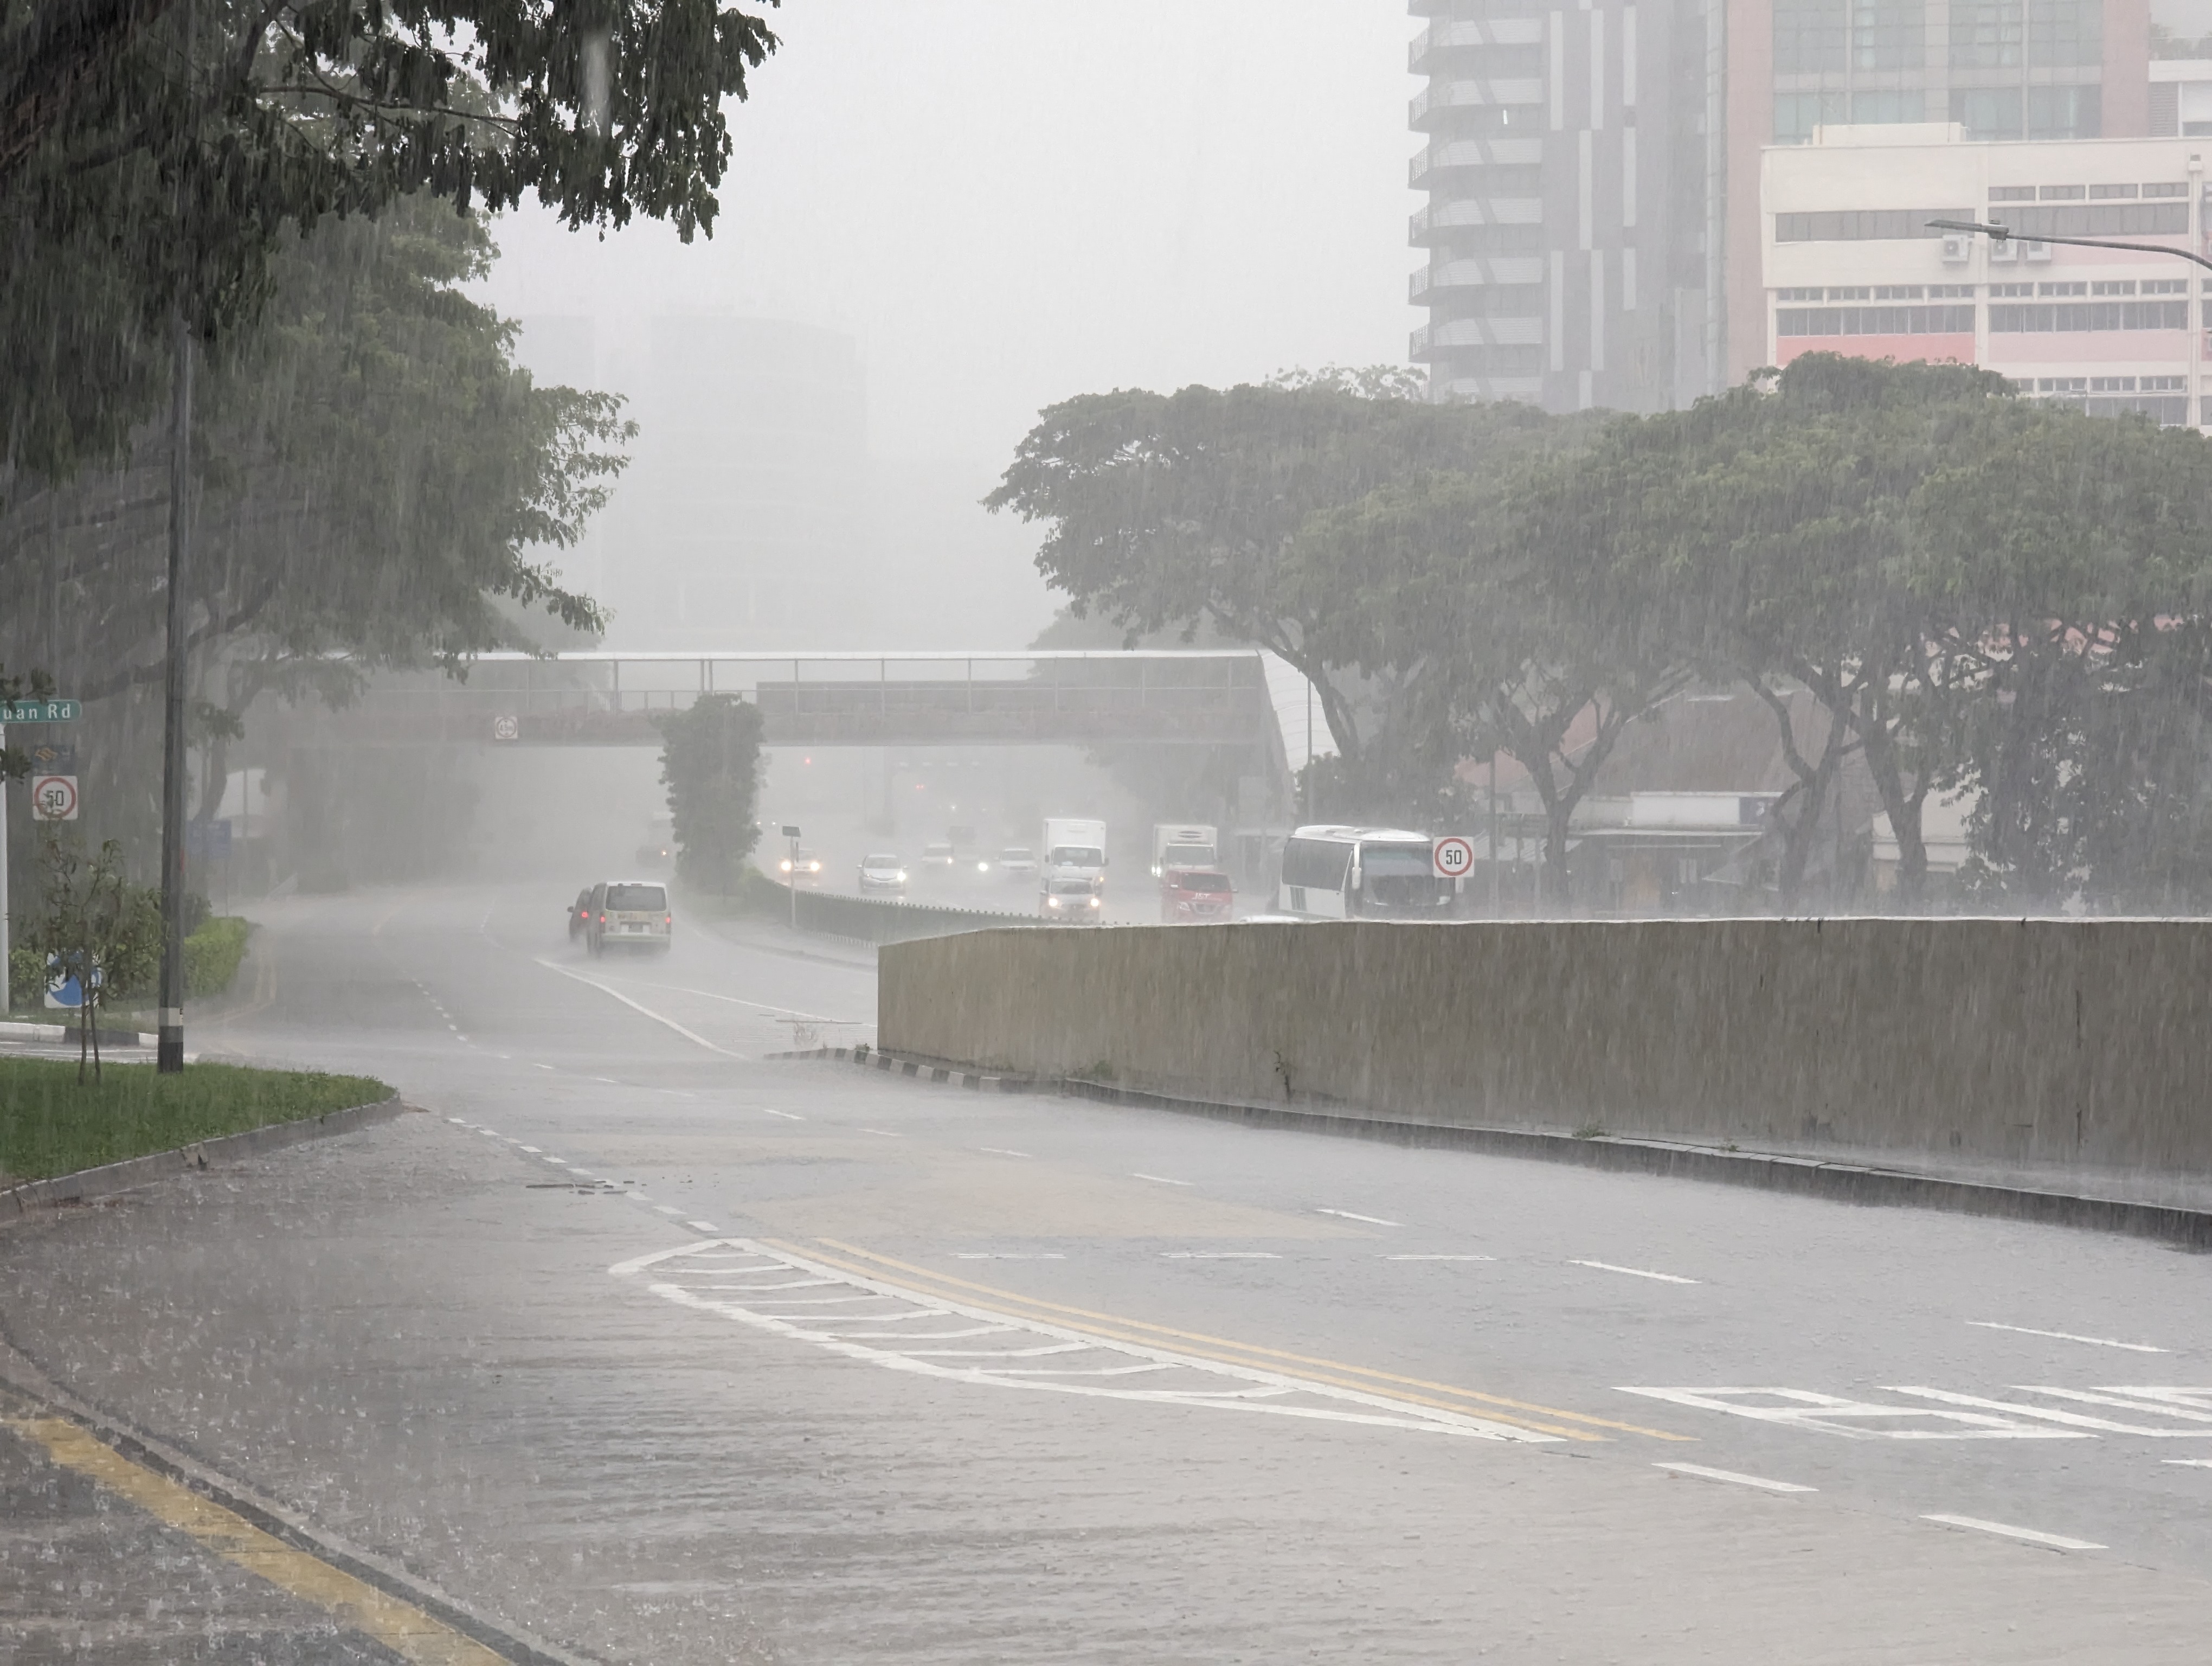
Changes in Mean Rainfall
Sea Level - Recent Changes and Projections
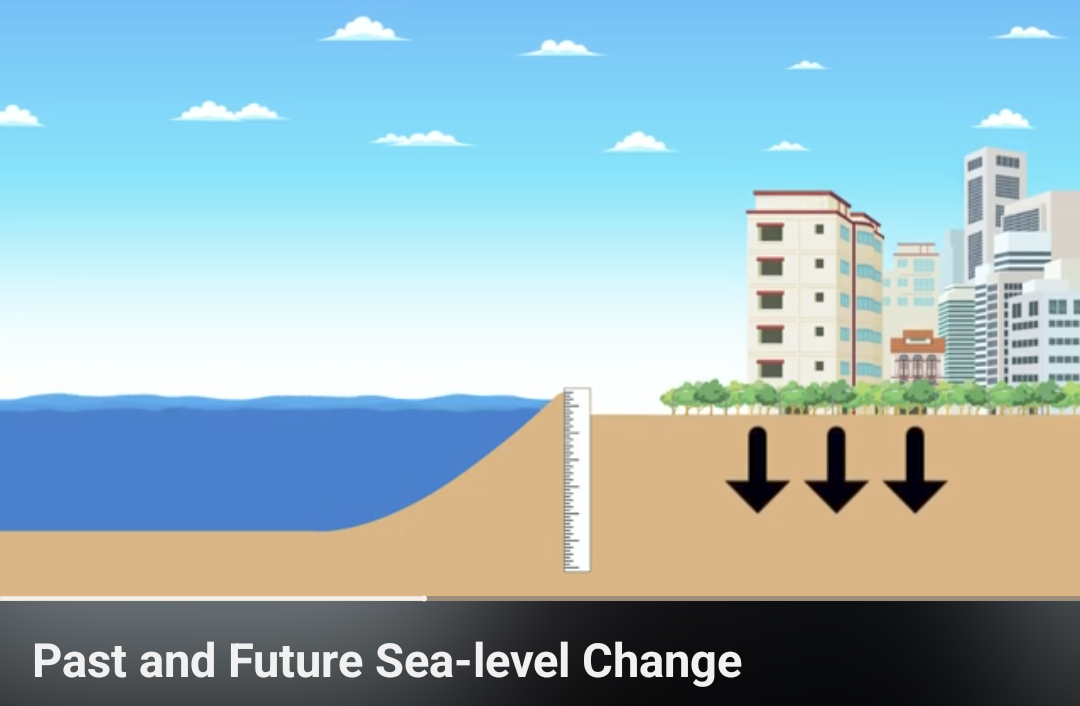
Recent Sea Level Change
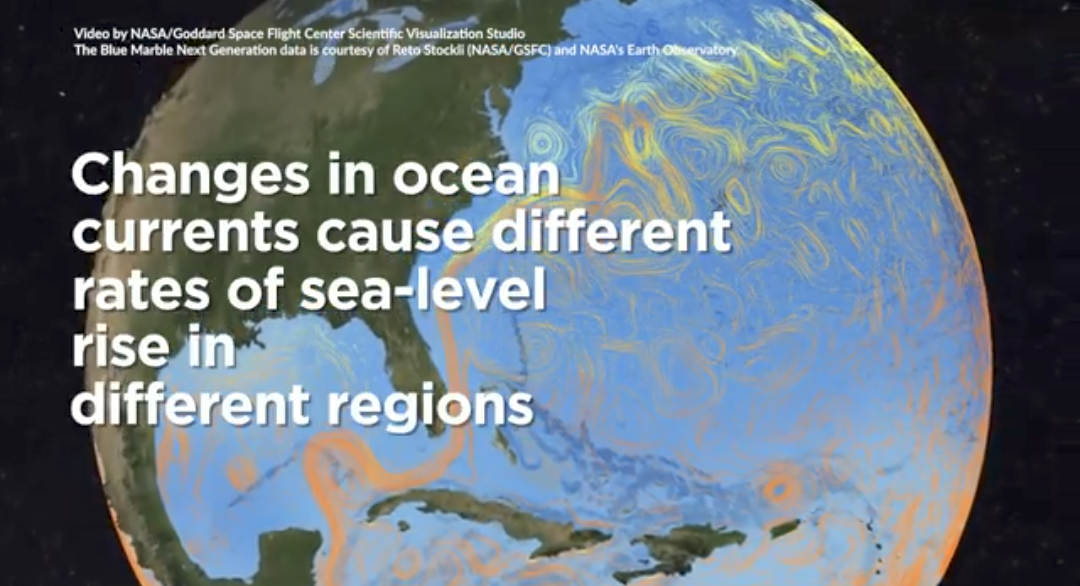
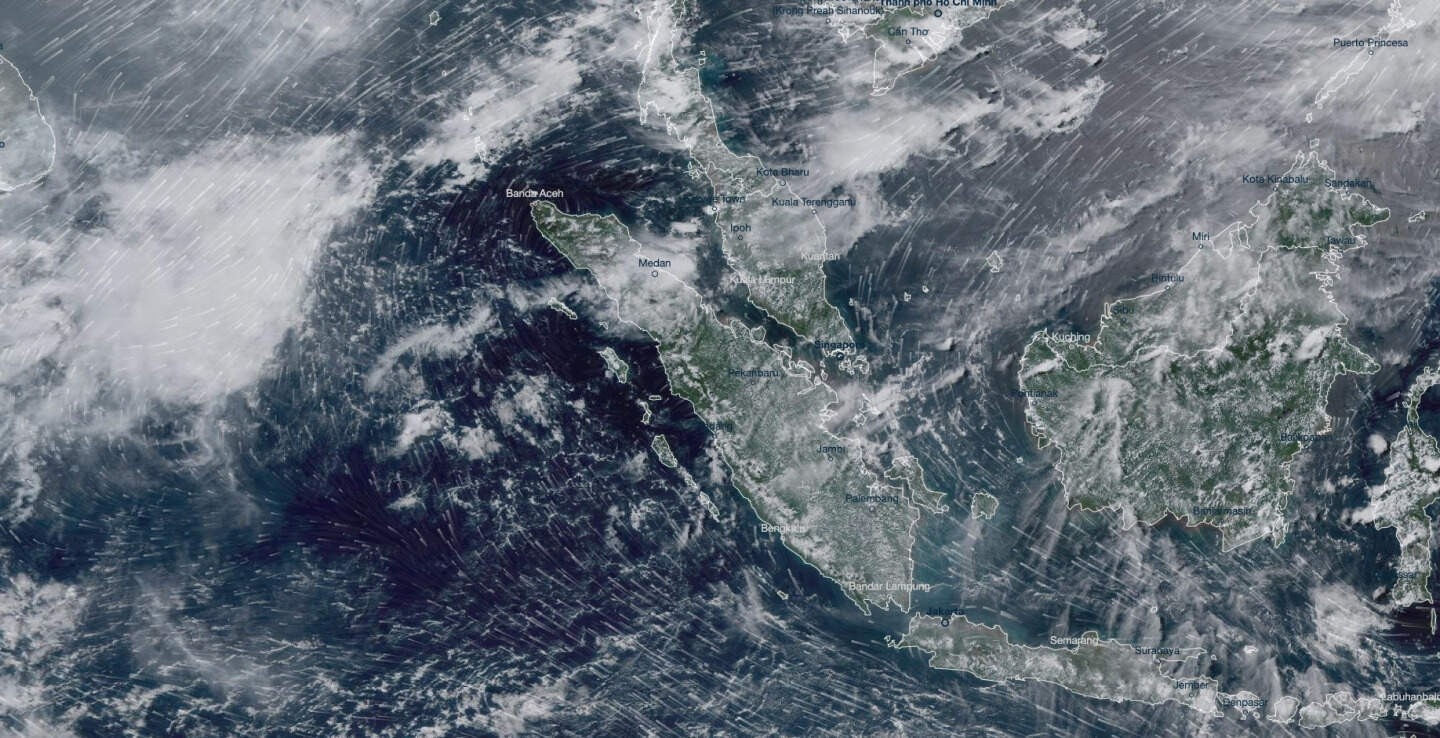
Mean sea level has been rising around Singapore and the region. Explore how sea levels have changed as measured from tide gauges around Singapore and those from satellite altimeter measurements for the region.
View more
Sea Level Projections up to 2150
Following the IPCC AR6 methodology, we provide state-of-the-art sea level time series projections for six tide gauge locations around Singapore and 13 regional locations around Southeast Asia. Sea Level projections around Singapore also show contributions from six key components (Antarctic ice sheets, Greenland ice sheets, Glaciers, Land Water Storage, Ocean Sterodynamics and Vertical Land Movement).
View more
Learn About V3
The Third National Climate Change Study (V3) is Singapore's next-generation of future climate projections. Get a broad overview on various aspects of the V3 Study by clicking ‘View more’.

V3 Explained
What is V3? What are its key features? What areas do V3 climate projections underpin? What data does V3 provide? Read our quick briefing note about what V3 is all about.

Key Findings of V3
A high-level summary of the most important results from the V3 Study for Singapore.