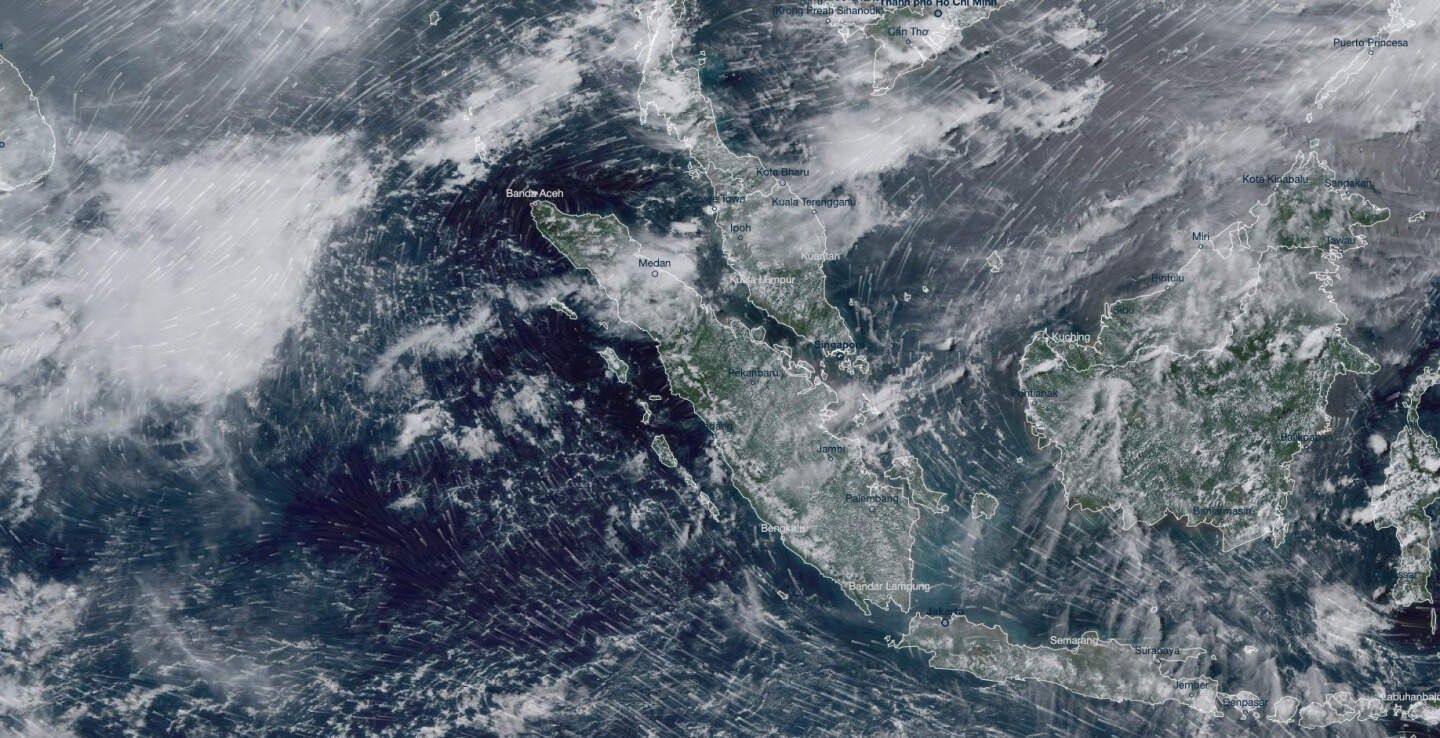
The Climate Visualiser dashboard allows users to browse our collection of maps from the 8-km and 2-km domains and time series for various locations for different Atmospheric variables and of Sea Level. Simply choose from the options available, click submit and visualise.
The evolution of relative sea-level rise at each of the six tide gauges around Singapore and 13 other locations around Southeast Asia to 2100, and by 2150 under the three Shared Socioeconomic Pathways (SSPs) are shown below. The range of possible values over time are characterised by the shaded area.
The locations of the 13 regional tide gauges are shown on the map.

Download chart as:
